BivariateViewer Overview
BivariateViewer Releases
BivariateViewer Features
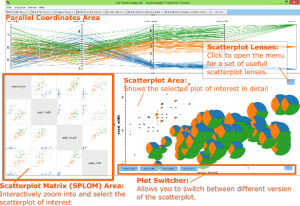
- Plot-Switschers
With the aid of our Plot-Switschers, you can easely switch between different views. The classic scatter plot allows you to view it as a scatter plot of two dimensions. The density plot shows you the distribution of the data as a density diagram. Statements about distribution and density properties can be easily found with it. The Pie-Scatter plot illustrates each data value as a pie chart. This gives a good idea of the distribution of all data and you can easily recognize very large data values. The inverted pie scatter plot inverts the pie scatter plot, so that now small values are very large in the representation, while large values are displayed very small and barely visible. This allows to easely find very small values in their data. In addition, many more views are available in our Plot-Switscher.
- Scatterplot Matrix Navigation
You can interactively navigate along the Scatterplot Matrix (SPLOM): You zoom in by using the mouse wheel, move along by moving the mouse while keeping it clicked, and you can select a scatter plot on demand by clicking on it.
- Rescaling
Every now and then it is important to see different views of different sizes. Therefore, here you can interactively control different sizes of the viewing areas in order to adapt the area sizes as desired. Clearly, you can enlarge or down size the views areas. This makes it easier to see interesting structures.